How to analyze the kinase activity using the SpectraMax® M5 Multi-Purpose Plate Reader and the IMAP® Fluorescence Polarization Detection Platform
Introduction
Protein kinases play a central role in regulating many cellular processes. In recent years, it has become an important target for cancer and many other diseases. IMA P is a fast, non-radioactive kinase assay developed by Molecular Devices, which is well suited for trial optimization and high throughput screening due to its technology. The IMAP detection technique is based on the principle that a phosphate ion is combined with a nanosphere particle having a surface-cured trivalent metal ion. When this binding reaction occurs, the trajectory of the fluorescently labeled polypeptide molecule changes, and the fluorescence polarization of the fluorescently labeled complex increases (see Figure 1.). Because it is a homogeneous method, it can ignore the detection method of the substrate polypeptide sequence, so it can be widely applied to the detection of various kinases.
When using IMAP technology for trial optimization and high-throughput screening, the SpectraMax M5 Multi-Purpose Plate Reader is an ideal and reliable detection platform. The SpectraMax M5 is a versatile microplate reader based on a grating-type monochromator that allows the user to select different detection wavelengths for different fluorescent dye molecules without the need for additional filter accessories. This application note details how to use the SpectraMax M5 Multi-Purpose Plate Reader and SoftMax® Pro software to perform calibration and red and green fluorogenic calibration curves, respectively, during the IMAP fluorescence polarization kinase assay. LCK is a tyrosinase that plays a key role in the T cell signal transduction pathway and prepares its dilution curve. In addition, Akt1/PKBa, a serine-threonine kinase, is involved in the signal transduction and cell viability of phosphatidylinositol kinase 3. In the test for inhibition of A kt 1 / PKB a by staurosporine, the Z' factor value obtained by the FAM and TAMRA labeled peptide substrates at the beginning of the reaction process was calculated, and the results were read with a filter-type multifunctional microplate. The results obtained on the trigger are consistent.
material
IMAP Rapid Screening Kit (Molec ular Devices Cat. #R8125)
IMAP binding reagent
IMAP Binding Buffer A (5X)
IMAP Binding Buffer B (5X)
IMAP Reaction Buffer (5X)
LCK kinase (Upstate Cat. #14-442)
Labeled FAM - p34cdc 2 Peptide Substrate (Molecular Devices Cat. #R7157)
Labeled TAMRA - p34cdc 2 Peptide Substrate (Molecular Devices Cat. #R7309)
Labeled FAM-p34cdc2-derived Phosphorylated Polypeptide Correction Reagent (Molecular Devices Cat. #R7271)
50 mM Adenosine 5'triphosphate (ATP) (Sigma Cat. #A6559) stored in pure water
100 mM DL-Dithiothreitol (DTT) (Sigma Cat. #D9779) stored in pure water
Staurosporine Biomol Cat.#EI-156)
Black polystyrene 384-well plate (Corning Cat. #3710)
Pre-installed with SoftMax Pro software computer and connected to SpectraMax M5 multi-function microplate reader (Molecular Devices)
method
Kinase reaction
Step 1. Add DTT to 1xIMAP reaction buffer and make DTT to a final concentration of 1 mM (1:100 dilution of 100 mM DTT stock solution) to obtain complete reaction buffer (CRB);
Step 2. Preparation of 400 nM (4x) of FAM or TAMRA-labeled polypeptide substrate in CRB (1:50 dilution of the original 20 uM polypeptide stock);
Step 3. Prepare 20 uM (4x) ATP in CRB (1: 2500 diluted original 50 mM ATP stock solution);
Step 4. Prepare a 4x dilution of the enzyme in a final concentration. For kinase inhibitor assays, a constant concentration of enzyme is used and a set of gradient dilutions of staurosporine or other kinase inhibitors is prepared.
Step 5.
The following reagents were added in parallel to the four replicate well kinase reactions:
5ul CRB or staurosporine
5ul enzyme (for the background well without added enzyme, add 5ul CRB as an alternative)
5ul 20uM ATP stock solution
5ul 400 nM peptide stock solution
Step 6. Incubate for 1 to 1.5 hours at room temperature.
Preparation of calibration standards
Step 1. Prepare a 100 nM polypeptide stock solution in CRB (using the same substrate as in the kinase assay);
Step 2. Prepare a 100 nM phosphate peptide stock solution in CRB (using the same phosphorylated substrate as in the kinase assay);
Step 3. Prepare the calibration standard by mixing the polypeptide and the phosphorylated polypeptide stock solution according to a certain rule as shown in Figure 1. The sample volume is sufficient for 4 replicate wells;
Step 4. Each 20 ul of calibration standard was removed to 4 replicate wells, including a set of blank background samples with only 20 ul of CRB.

Binding reaction
Step 1. Mix 75% of binding buffer A with 25% of binding buffer B to prepare binding buffer;
Step 2. The binding reagent is diluted 1:600 ​​times into a binding buffer to obtain a binding reaction solution;
Step 3. Remove 60 ul of binding reaction solution into each detection well and calibration standard well (including background well sample)
Step 4. Incubate at room temperature for 1 hour in the dark
Set up the template on the SoftMax Pro software and take readings on the SpectraMax M5 Multi-Mode Microplate Reader
Note: Templates for IMAP fluorescence bias experiments for FAM and TAMRA-labeled substrates have been preset on the SoftMax Pro 5 software, as described in the Binding Assays template folder.
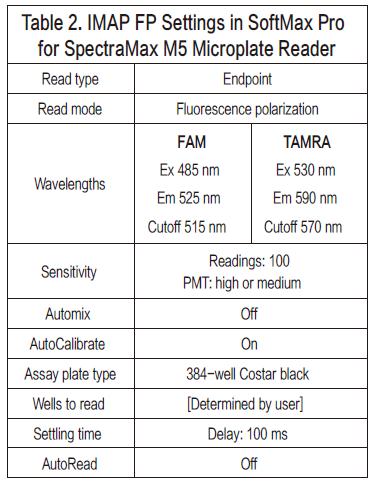
Step 1. Open the IMAP fluorescence polarization template for fluorescein on the SoftMax Pro software. The FAM and TAMRA templates are preset; if you are not using FAM and TAMRA fluorescein, simply adjust the wavelength setting. For parameter settings on the SpectraMax M5 Multi-Mode Microplate Reader (see Figure 2).
Step 2. Set up a test template, select the background sample well, the kinase sample well, and calibrate the standard well. Kinase test samples and calibration standards can be assigned to a preset set of 8 samples on the SoftMax Pro software template. Before calculating the minimum polarization value (mP), the control product containing only the buffer is first divided into the corresponding background group, and the background fluorescence value is automatically deducted using software.
Step 3. After placing the microplate into the reader - make sure the purple tray (adapter) is placed on the microplate holder - then click on the Read panel.
result
The IMAP fluorescence polarization template preset in SoftMax Pro software automatically calculates the horizontal polarization mean and vertical polarization mean (mP value), total fluorescence intensity, standard deviation and CV value. In the group column of each set of test samples, the template automatically deducts the fluorescence polarization value of the background sample and then calculates the minimum polarization mP value. The sample phosphorylation ratio can also be calculated from the corresponding calibration curve. (See IMAP Application Note #4, "Developing calibration curves for IMAP")
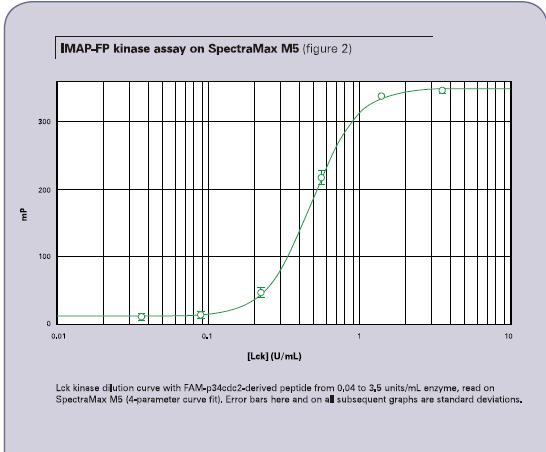
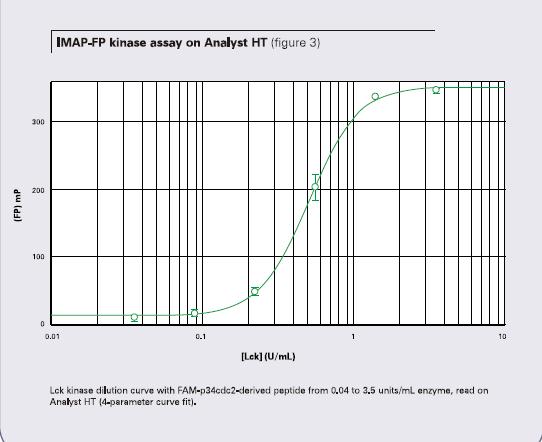
Figure 2 shows the dilution curve of one LCK kinase obtained using the FAM-p34cdc2 polypeptide. When tested with a SpectraMax M5 microplate reader, the enzyme concentration ranged from 0.04 to 3.5 units/ml with a minimum polarization of 303 and a Z' factor of 0.87. Figure 3 shows the fluorescence polarization value of 336 and the Z' factor of 0.95 when the same well was detected using the Analyst HT Multi-Function Microplate Reader. Both instruments received EC50 values ​​of 0.5 units/ml.
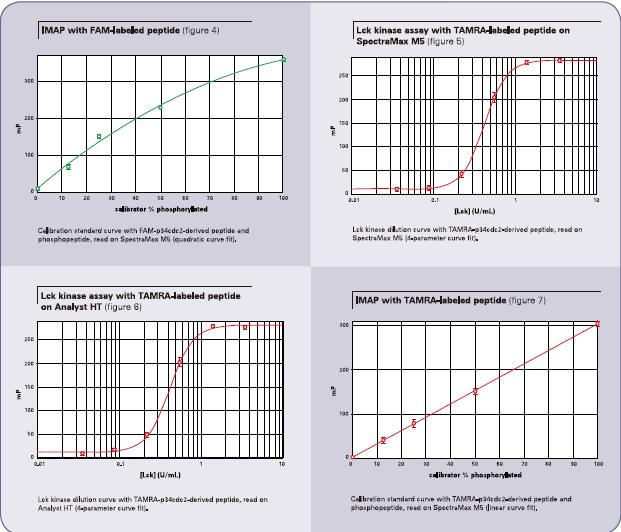
If a non-phosphorylated and phosphorylated polypeptide sample is used as a calibration curve for quality control, the fluorescence polarization value can be displayed as a percentage to give a degree of phosphorylation. (See Figure 4.) First create a new curve (software default name is Graph#1), and use the fluorescence polarization value (mP value) to compare the phosphorylation percentage (concentration) as a curve for your quality control sample group. The default name of the curve is “Plot#1.†In the Calibration Standards group column, after creating a new column, enter the following formula, namely:
InterpX('Plot#1@ Graph#1@IMAP FP_FAM', AvgbkgsubmP). And use 'IMAP FP_FAM' as the test name.
To determine the effect of the IMAP kinase assay using a red fluorescent dye, the results of another LCK kinase dilution curve were obtained from the TAMRA-p34cdc2 polypeptide. (See Figure 5.) The results were measured using a SpectraMax M5 microplate reader. The enzyme concentration ranged from 0.04 to 3.5 units/ml, the fluorescence polarization value (mP value) was 258, and the Z' factor value was 0.95. In Figure 6, the same test using the Analyst HT microplate reader showed a fluorescence polarization value (mP value) of 270 and a Z' factor of 0.93. Both plate readers obtained EC50 values ​​of 0.4 units/ml, consistent with FAM-labeled substrate acquisition results. A related calibration curve has also been established (See Figure 7.). The similar results of TAMRA and FAM also allow the user to take advantage of the red fluorescent dye, which is able to minimize the background fluorescence produced by the compound.
to sum up
As researchers work to explore the role of kinases in cell signaling pathways and various diseases, as well as the regulatory mechanisms that play a role in the treatment of many diseases, they increasingly expect non-radioactive, homogeneous detection methods. It can be used for assay optimization and screening of high-throughput drugs. Fluorescence polarization assays provide a homogeneous, high-throughput way to identify activators, inhibitors, and substrates for various kinases. IMAP fluorescence polarization detection using the SpectraMax M5 multi-plate reader: the results are accurate, repeatable, and have a high Z' factor. The double-grating monochromator system allows users to select different fluorescent dye-labeled peptides. The substrate is optimized for testing without the need for additional filters. In addition, the IMAP fluorescence polarization kinase assay was performed on substrates labeled with green or red fluorescent dyes, and the results obtained were consistent with the values ​​found on a microplate reader using a filter-type monochromator. Finally, the preset IMAP fluorescence polarization template on SoftMax Pro software provides a more convenient way to collect and analyze fluorescence polarization data, and these templates can also be used for the detection of different fluorescent dye molecules.
reference
1.IMAP Akt Assay Kit Product Insert (Molecular Devices product #R8058).
2.Developing calibration curves for IMAP (IMAP Application Note #4).
3.Zhang, JH, Chung, TDY, and Oldenburg, KR (1999). A simple statistical parameter for use in evaluation and validation of high throughput screening assays. J Biomol Screen 4 (2): 67-73.
JRT usb interface distance sensor board adds a USB port to a Laser Distance Sensor, inexpensive laser distance measurement sensors, allowing customers directly using GBeacon-2.3-Fx.exe software to control the rangefinder sensor. Usb laser distance sensors are the the most popular model devices, it works by measuring the phase of an visible-red laser beam that reflects on the target. Usually, customers would like to choose CH341SER.EXE version to test.
USB Laser Distance Sensor,Distance Sensor,Laser Distance Sensor,Distance Measurement Sensors
Chengdu JRT Meter Technology Co., Ltd , https://www.rangesensors.com